The Data Is In: New Study Weighs Sustainability of Animal-Free Dairy
Perfect Day has invented a new way to make the dairy foods people love today, for a kinder, greener tomorrow. Our technology uses production methods that are both efficient and scalable, meaning we do more with less.
But it’s not enough to say it — we need to be able to show it! To that end, we commissioned a life cycle assessment (LCA) to quantify the total greenhouse gas emissions generated by our whey protein production system from start to finish.
The goal of the study was twofold. First, we wanted to understand the greenhouse gas emissions from producing 1 kg of our animal-free whey compared to the emissions generated to make the equivalent amount of bovine dairy protein. Second, we hoped to identify opportunities to achieve an even lower emissions impact by uncovering the aspects of our process that generate the most greenhouse gases. We hold ourselves to the highest standards, and this means always finding ways to improve.
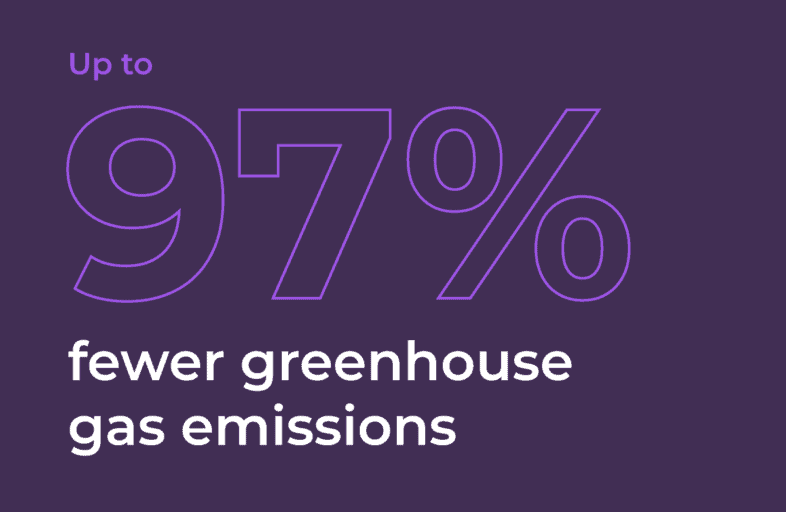
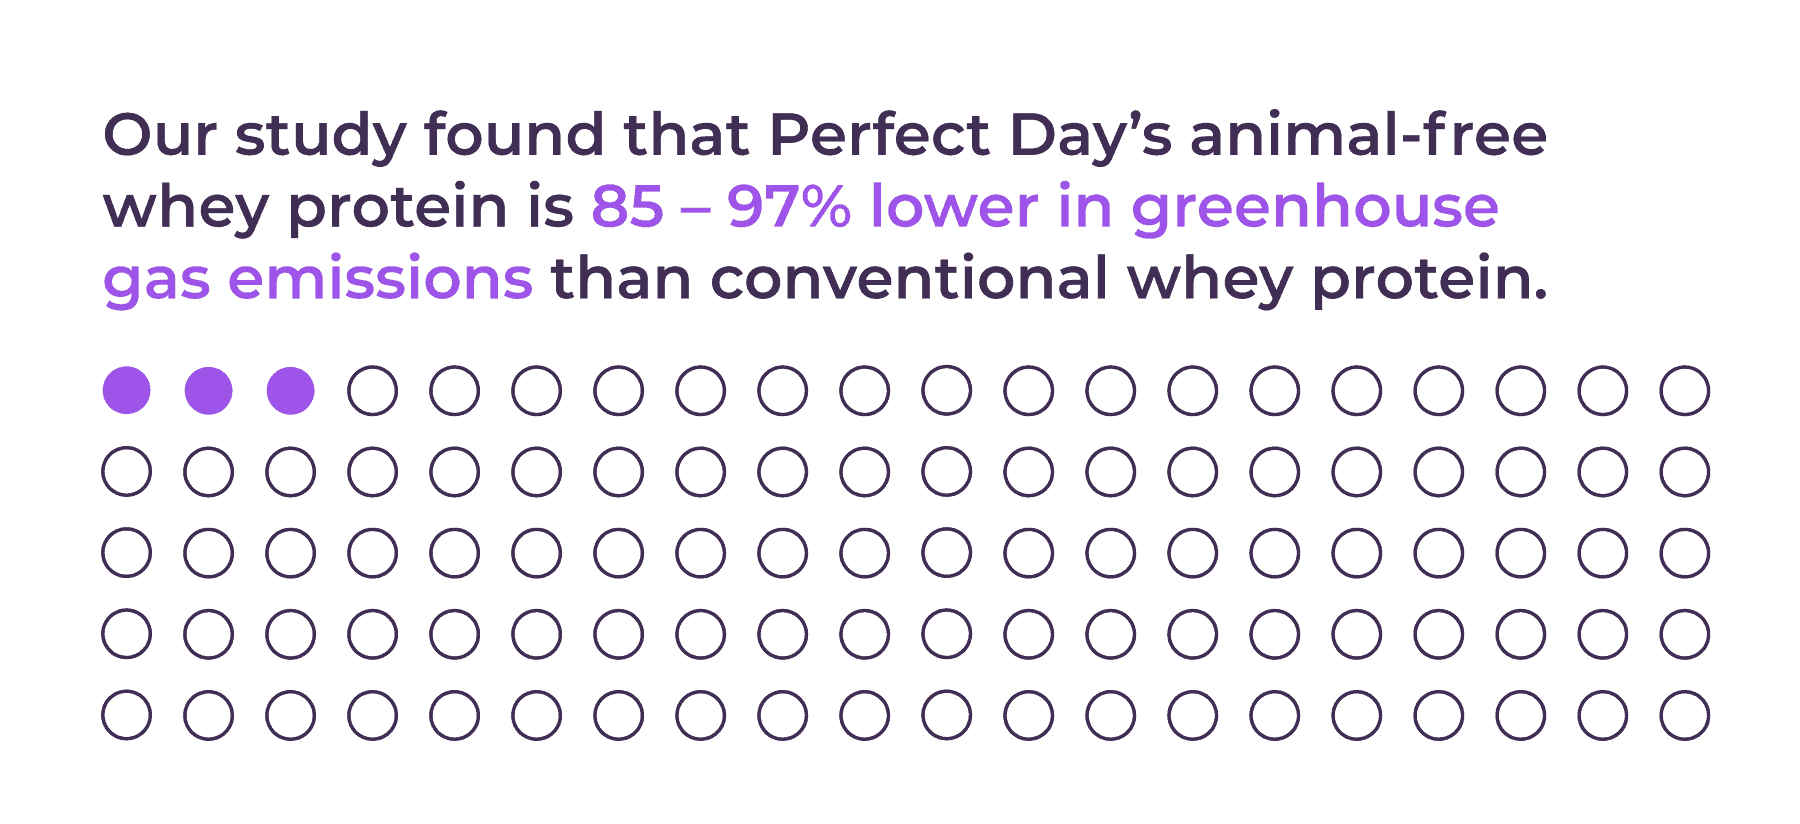
Our study found that Perfect Day’s animal-free whey protein is 91–97% lower in greenhouse gas emissions than conventional whey protein.
To understand the impacts of the above statistic, it’s helpful to know why greenhouse gas emissions matter and what life cycle assessments are.
The Importance of Greenhouse Gas Emissions
We hear about greenhouse gas emissions all the time, but what is their actual role in climate science? Here’s a summary.
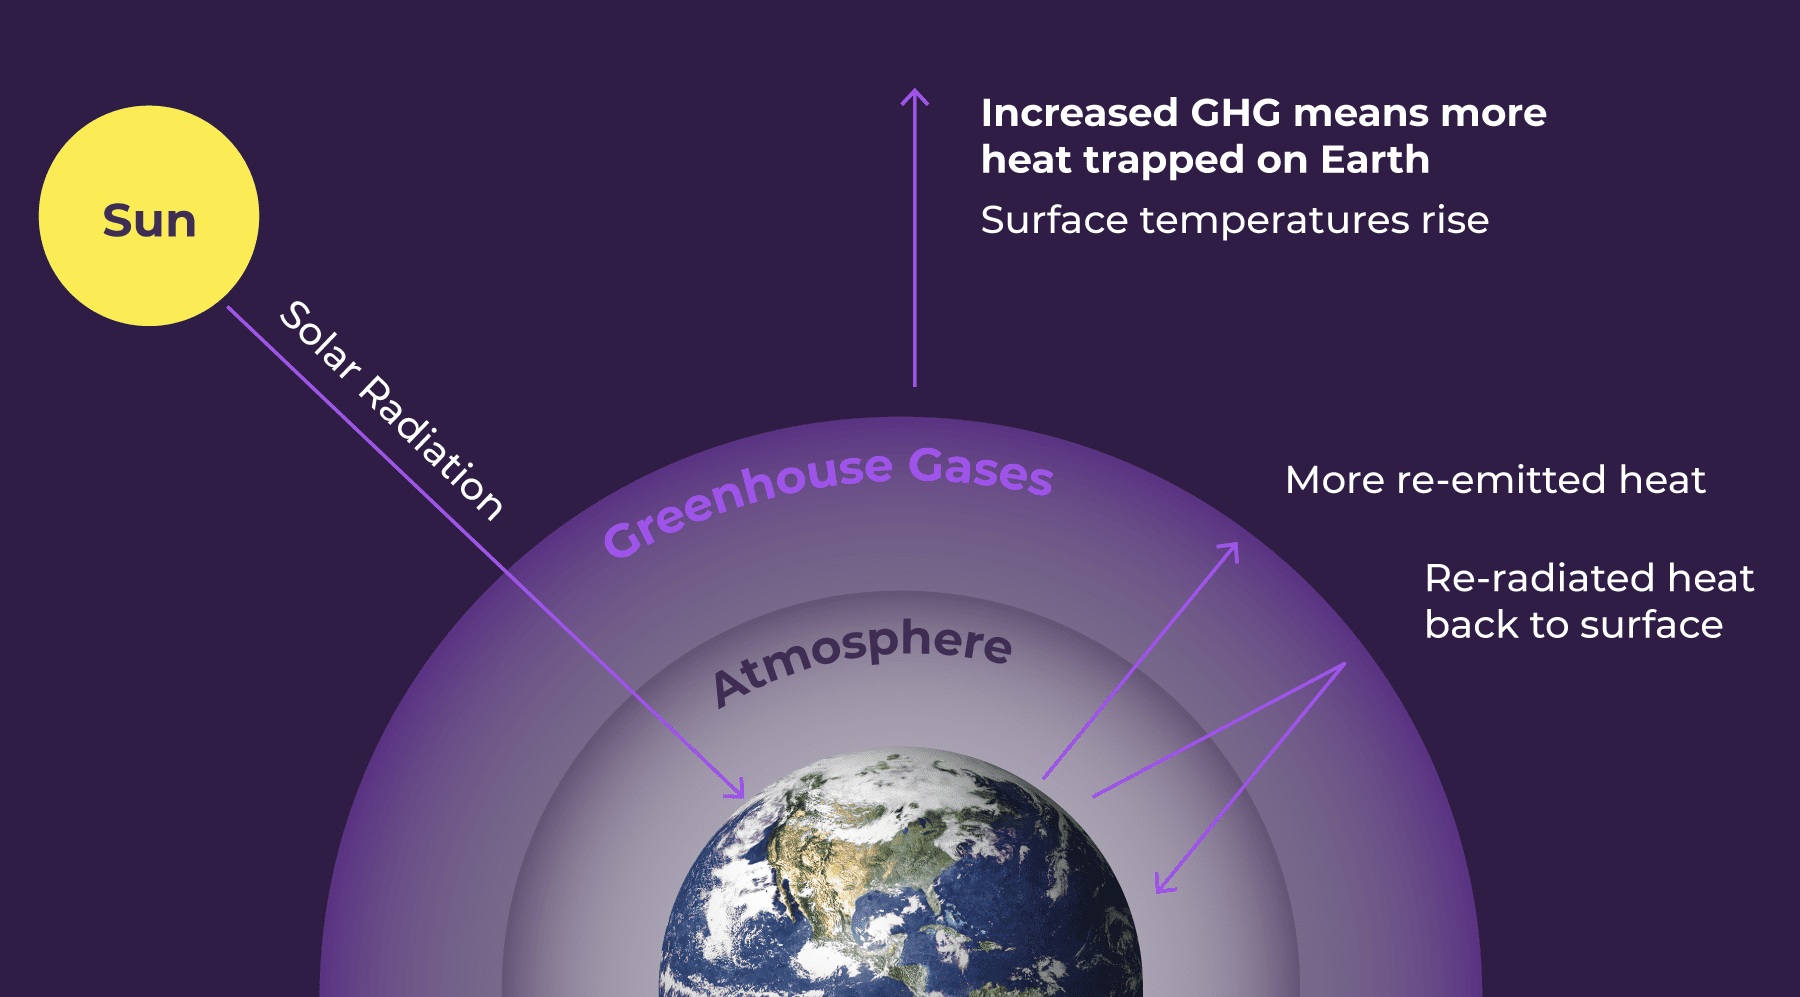
Earth is habitable because its atmosphere and distance from the sun ensure that it is not too hot and not too cold. It’s just the right temperature to sustain life. The earth’s atmosphere maintains that temperate sweet spot only as long as it has the right mix of gases. These gases include the oxygen we breathe, but also carbon dioxide (CO2), water vapor, methane, nitrous oxide, and ozone. They’re known collectively as greenhouse gases because they act like a greenhouse’s glass walls, letting in more of the sun’s heat than they let out. (Because CO2 is the most common greenhouse gas emitted by human activities, you’ll often see these other gases referred to as CO2-equivalents, or CO2e, in order to express them as a common unit.1)
Some warmth is a good thing, of course — the universe beyond our cozy “pale blue dot” is a frigid place, and we need our protective atmospheric blanket to survive. But if the proportion of greenhouse gases is altered, Earth will get too toasty, disrupting the conditions that sustain life as we know it.
What Is a Life Cycle Assessment?
A life cycle assessment (LCA) is an evaluation of the environmental impacts of a product, measured by the inputs used for its production all the way along its supply chain. In other words, an LCA looks at everything it takes to produce a single product, and then measures the greenhouse gas emissions (and other environmental metrics) associated with each of those inputs.
Life cycle assessments are overseen by the International Organization for Standardization (ISO), an independent, nongovernmental body that sets the standards for performing these types of studies. Our study was reviewed for conformance to ISO standards by a panel of independent experts who have backgrounds in energy, chemical engineering, dairy, and emissions.
How We Did This Study
To conduct our study, we enlisted the help of WSP USA, Inc., a leader in life cycle assessments. Our LCA looked at the greenhouse gas emissions associated with our animal-free whey protein from cradle (the point of both direct and indirect resource extraction) to gate (the manufacturing gate: the point at which we hand our raw protein powder over to a food maker for use in products).

Importantly, our LCA didn’t look only at Perfect Day’s emissions, but compared them to prior LCAs published by the bovine dairy industry to assess emissions from bovine whey. Perfect Day provided WSP with primary data regarding our material inputs, production processes and volumes, and transportation information. WSP used ISO-compliant databases to source information about the material and energy extraction associated with the production of comparative proteins.
Our study put all of this data together to create a clear picture of exactly where Perfect Day’s emissions stand in comparison to existing bovine dairy production practices.
Our Findings and Impact
WSP found that Perfect Day’s animal-free whey protein is 91–97% lower in greenhouse gas emissions than conventional bovine whey protein.
If U.S. food makers (and by extension, their customers — anyone who eats dairy), switched entirely to making their products with Perfect Day’s animal-free whey protein, we could avoid 246 million tonnes of CO2e emissions.
To put this in more relatable terms:
- The greenhouse gas savings would be equivalent to removing up to 53 million passenger vehicles from roads each year. That’s equivalent to the number of cars in California, Florida, New York, and Texas combined.2
- Put another way, it would save the equivalent emissions from powering 44 million homes — a third of all U.S. homes — with electricity each year.3
Realistically speaking, Perfect Day protein is not going to show up in every single dairy product overnight. But what if U.S. food makers switch only 5% of the bovine whey they use to animal-free whey protein?
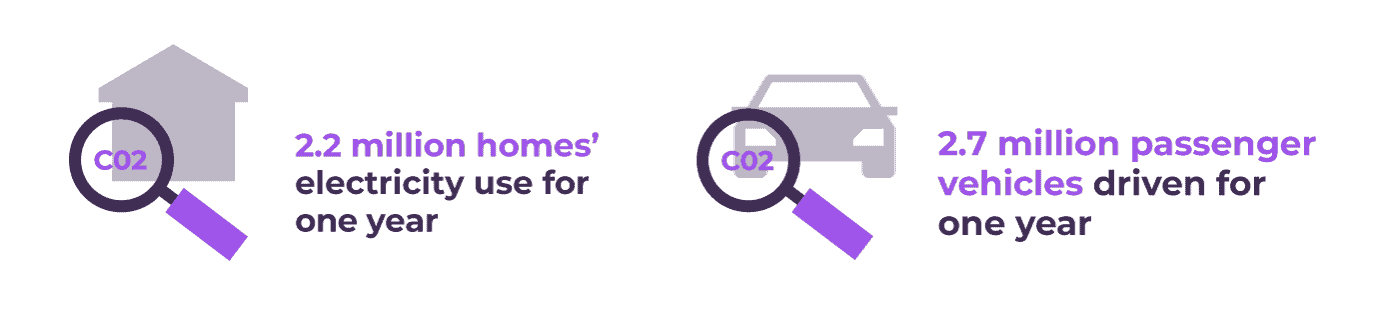
The results still look very good. With only 5% of products converted to animal-free whey protein, we’d still save up to 12.3 million metric tonnes of CO2e emissions. This is equivalent to:
- Removing up to 2.7 million passenger vehicles from roads each year (equivalent to the number of cars each registered in Arizona, Colorado, or New Jersey2); or
- Offsetting the emissions from 2.2 million homes’ electricity use each year (equivalent to more than all new homes built annually in the U.S.).3
These are incredible results that we’re excited to share with the world. And that brings us to our second objective: could we be doing even better?
To answer that question, the study also looked at where the emissions in our production process come from. Unsurprisingly, we found that the largest driver of Perfect Day’s CO2e emissions is utilities, comprising 40% of our total emissions. Since utilities rely on a mix of energy sources, we assumed the same predominant makeup as the U.S. electrical grid: natural gas (33%), coal (31%), nuclear (20%), hydro (7%), wind (5%), biomass (1%), and photovoltaic (1%). (Other sources comprising <1% contribution to the US electrical grid include solar thermal and geothermal energy.)
Now that we know that utilities are the biggest driver of our emissions, we’re in the process of collecting additional data to refine the utility model used in this first LCA. This will help us identify more efficient manufacturing alternatives to address our utilities’ outsize impact on our total greenhouse gas emissions.
The Dairy Industry Is Making Meaningful Strides — and Perfect Day Will Help
In the United States, the dairy sector produces more than 97 million tonnes of milk (excluding butter). This production results in up to 255 million metric tonnes of CO2 emissions, according to the Food and Agriculture Organization of the United Nations.4
This is not to say the conventional dairy industry is not making its own positive strides on greenhouse gas emissions, however. According to a 2020 study of the California dairy industry (California being the United States’ top dairy-producing state), one liter of milk from a dairy cow in 2014 generated 46.9% lower greenhouse gas emissions than one liter of milk 50 years earlier, in 1964.5 These savings are thanks to improvements in bovine nutrition, breeding, feed production, milking, storage, and transport methods.
A nearly 50% decrease in emissions per individual liter of milk is significant improvement! But livestock emit 14.5% of human-caused greenhouse gases globally, with emissions from cows causing the majority.6 And when you consider that total dairy production in California has ballooned by 500% in that same 50-year time frame,7 it’s clear we have more work to do together.
Perfect Day believes that partnering with existing leaders in dairy is the fastest and most effective path to minimizing the food sector’s total greenhouse gas emissions. The planet — and all the people and creatures who share it — don’t have another 50 years to wait.
Using Data for Positive Change
Perfect Day’s work to understand our environmental impacts will not stop at greenhouse gas emissions. We presently have work underway to put numbers on other facets of our animal-free whey production, and we’re eager to share that data once we have it.
Climate change demands urgent attention within all sectors. But tangible solutions aren’t just lofty future goals. They’re already available, and we’ll continue to refine them. We want people to continue enjoying the tasty, nutritious dairy foods they love, and we’ve found a way to make that happen without compromising our planet’s future. By changing the process, not the food, we are opting in to a greener, more resilient, and diverse food system for all of us.
- Brander, Matthew. (n.d.). Greenhouse gases, CO2, CO2e, and carbon: What do all these terms mean? Ecometrica. ecometrica.com/assets/GHGs-CO2-CO2e-and-Carbon-What-Do-These-Mean-v2.1.pdf
- Statista. (2020). U.S. automobile registrations in 2019, by state. statista.com/statistics/196010/total-number-of-registered-automobiles-in-the-us-by-state/
- United States Environmental Protection Agency. (n.d.). Greenhouse gases equivalencies calculator – Calculations and references. epa.gov/energy/greenhouse-gases-equivalencies-calculator-calculations-and-references#houseenergy
- Food and Agriculture Organization of the United Nations (FAO). (n.d.). New food balances. FAOSTAT. fao.org/faostat/en/#data/FBS
- Naranjo, A. et al. (2020). Greenhouse gas, water, and land footprint per unit of production of the California dairy industry over 50 years. Journal of Dairy Science. 103(4). journalofdairyscience.org/article/S0022-0302(20)30074-6/fulltext
- Gerber, P.J. et al. (2013). Tackling climate change through livestock – A global assessment of emissions and mitigation opportunities. Food and Agriculture Organization of the United Nations (FAO). fao.org/news/story/en/item/197623/icode/
- Bryce, Emma. (2020, April). In terms of carbon, is this glass of milk half full or half empty? Anthropocene. anthropocenemagazine.org/2020/04/californian-dairy-farms-have-halved-their-emissions-since-1964/
We’d love to hear your thoughts!
Your email address will not be shared.